PRTG‘s built in sensors can be used to monitor just about anything. Network gear is especially easy since most of it supports SNMP. But there’s kind of a catch with PRTG licensing. PRTG is licensed by number of sensors. When each one counts (for those of us not lucky enough to have an unlimited license) any kind of per-port monitors add up fast when you’re looking at 24/48/96/+ port switches. Since port status is a good early indicator of an outage, I wanted to monitor the ports on a few of my switches.
What I ended up creating is a sensor script that can monitor the status of all of the ports on a switch with a single sensor.
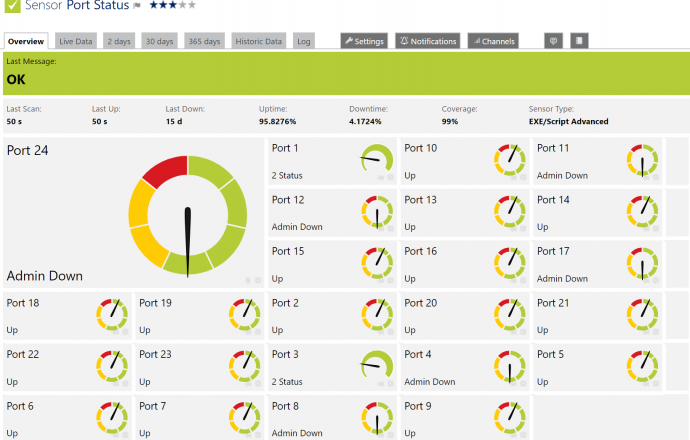
Overview
Script download: https://github.com/xawen/PRTG-PortStatus/releases/
The sensor script will query the ports status for each port on a switch via SNMP and look for the standard status codes. The following port status are assigned PRTG health states:
- Up (1) = Green (OK)
- Down (2) = Red (Down)
- Testing (3) = Warning (Yellow)
- Unknown (4) = Warning (Yellow)
- Dormant (5) = Green (OK)
- Not Present (6) = Green (OK)
- Admin Down (7) = Green (OK)
The intention is that if you need to down a port without PRTG erroring, you administrative disable the port on the switch. These statuses can also be overriden on a per channel basis in PRTG if you rather.
There’s only one script in this release.
- Switch-PortStatus.ps1 – Monitor connection status of all ports on a switch. Port will show OK/green if it is up or administratively down. Port will show error/red if it is down or has errors.
Configuration
Dependencies
Download SnmpWalk.exe to the PRTG server. Copy SnmpWalk.exe to the Custom Sesors\EXEXML directory (default location is: C:\Program Files (x86)\PRTG Network Monitor\Custom Sensors\EXEXML).
Configure a read only SNMP community string on the network switch. You’ll also need to be sure that the appropriate PRTG probe can reach the switch via SNMP.
Load the scripts into PRTG
Copy all of the .ps1 files to the Custom Sesors\EXEXML directory (default location is: C:\Program Files (x86)\PRTG Network Monitor\Custom Sensors\EXEXML).
Copy all of the .ovl files to the lookups\custom directory (default location is: C:\Program Files (x86)\PRTG Network Monitor\lookups\custom)
Reload the PRTG lookup tables. In PRTG go to Setup > Administrative tools and choose Reload lookups. If PRTG is unable to find the scripts, or doesn’t display the names for the sensor statuses, restart the core server.
Create the sensor
If it’s not there already, create a new device in PRTG for the network switch. Set the SNMP credentials for this device to the read only community string on the switch.
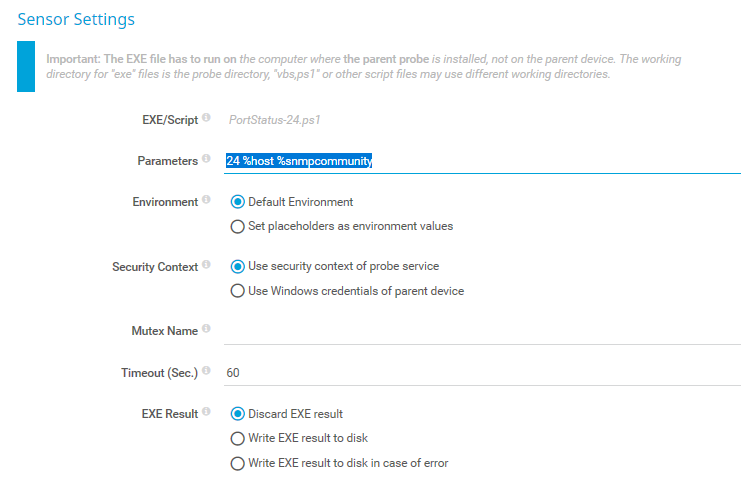
Add a new EXE/Script type sensor to the switch device entry. Name it as you like. Choose Switch-PortStatus.ps1 in the EXE/Script field. Under Parameters, enter ‘<Port Count> %host %snmpcommunity’ where <Port Count> is the number of ports in the switch. The script will start with port 1 and count up to the number you choose.
Notes
This sensor script uses the standard SNMP networking MIBs to retrieve the port information. It should work with any switch that supports SNMP with the standard MIBs. Keep in mind there are some stubborn network vendors that “forget” or only partially implement the standard MIBs. If you run into one of those the script can be easily adapted, but you’ll need to use SNMPWalk to figure out the correct OIDs.
PRTG only officially supports 50 channels on a single sensor. If you choose a higher port count, you can easily exceed that with this script. I have tested higher counts, and they work. But, be aware that it won’t be supported. The reason is that a sensor with too many channels can take too long to query and may produce false errors.
I tried to implement your script. unfortunately it does not work with the prtg release 18.4.45.1898+. has something changed?
Thanks
Patrick